Summary
An application guide to machine learning and high-content image analysis on tumor spheroids, with links to peer-reviewed research from our publication library.
Machine Learning and Image Analysis on Tumor Spheroids: Application Guide
Quantifying what spheroids look like
3D culture produces richer endpoints than viability alone — morphology, cell–cell interaction, and microtissue organization all become measurable — but extracting them requires image analysis at scale. Published work in our library covers machine-learning-assisted high-content imaging pipelines built on 3D microtissues, automated image analysis of spheroid size, morphology, and solidity, and machine-learning classification of cancer cell subpopulations from single-cell particle uptake patterns.
Related library studies address the measurement problems underneath: integrated elasticity regression for analyzing compression data from irregularly shaped clusters, and multi-assay cytotoxicity analysis combining several mechanistically distinct readouts, which revealed injuries no single-biomarker assay detected.
Why array geometry matters for imaging
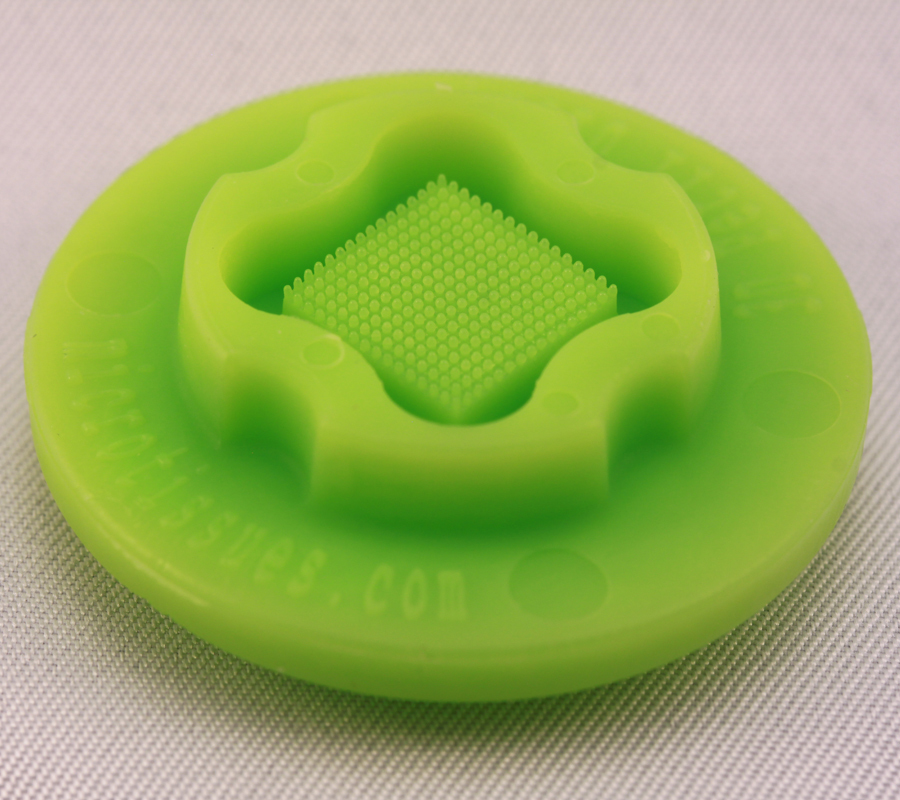
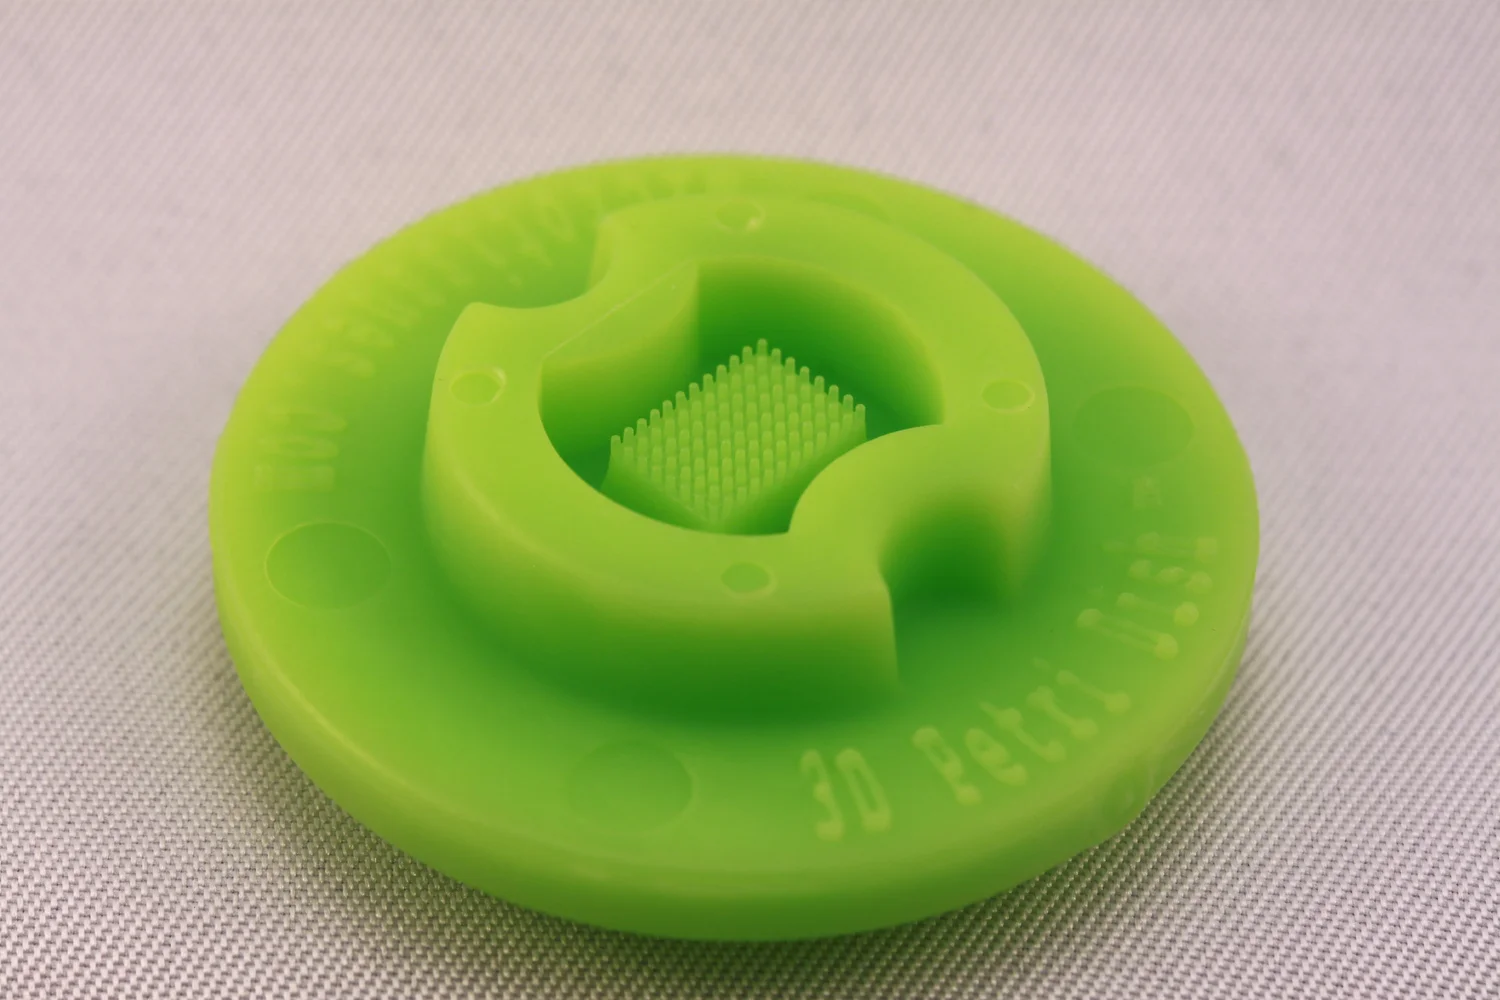
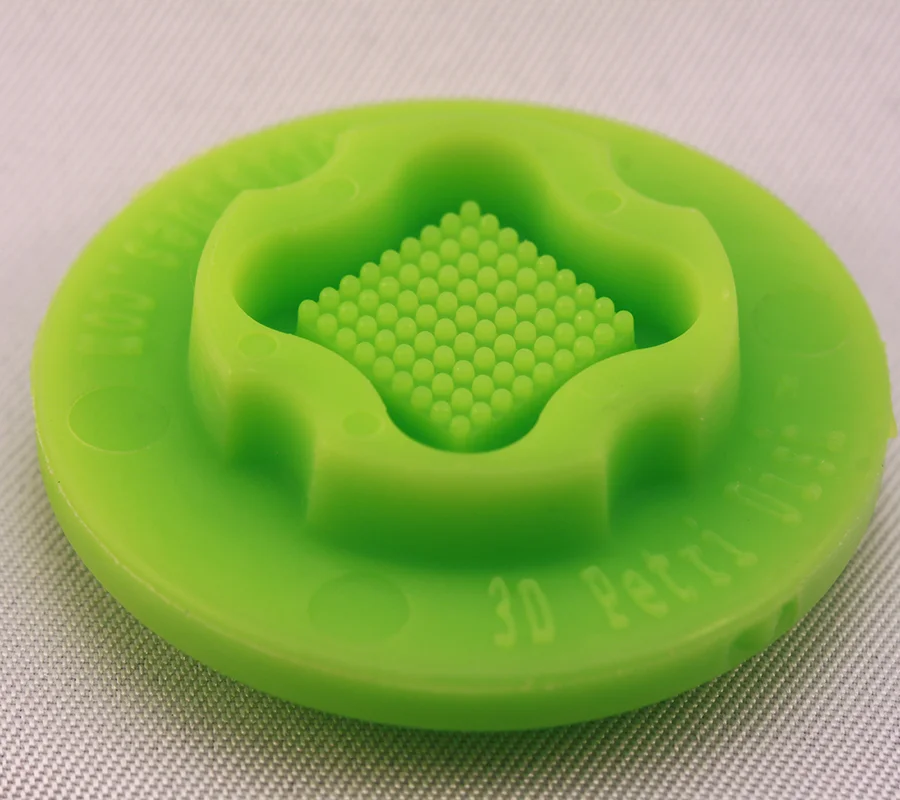
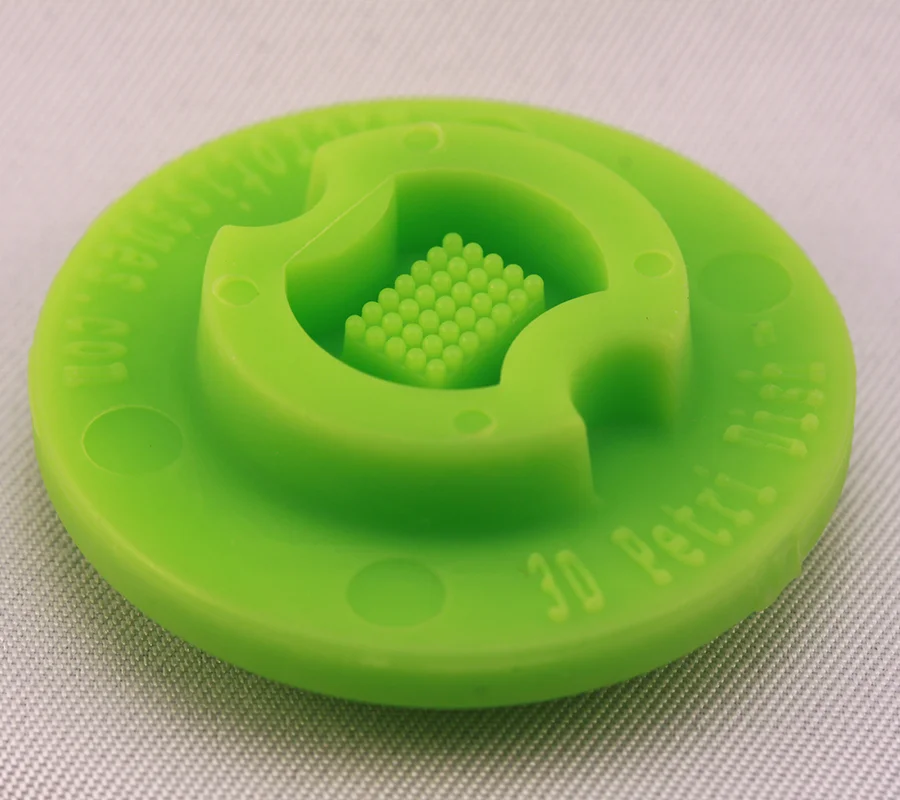
Because the cast agarose gel holds one microtissue per recess in a fixed array, spheroids sit in known positions on the same optical plane — which is what makes automated acquisition and batch image analysis practical. The gel is optically clear, so imaging works on a standard inverted microscope in brightfield, phase contrast, or fluorescence without harvesting.
Uniformity helps too: spheroid size is set by the number of cells seeded, so an array yields size-matched microtissues rather than a heterogeneous population — one published study specifically warns that heterogeneously sized microtissues confound transcriptomic and proteomic results.
Peer-reviewed studies
See the cancer spheroids research hub for published oncology studies using the 3D Petri Dish®.